
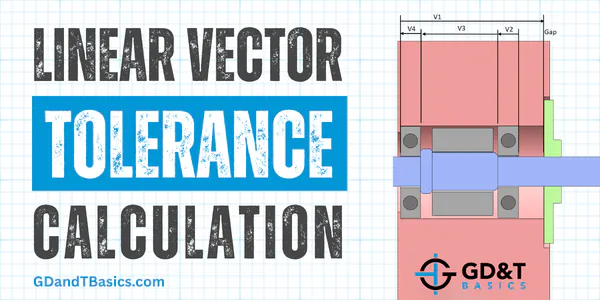

In this Question Line video, Jason demonstrates how to perform a basic linear vector tolerance calculation using an example taken directly from our GD&T Design course.
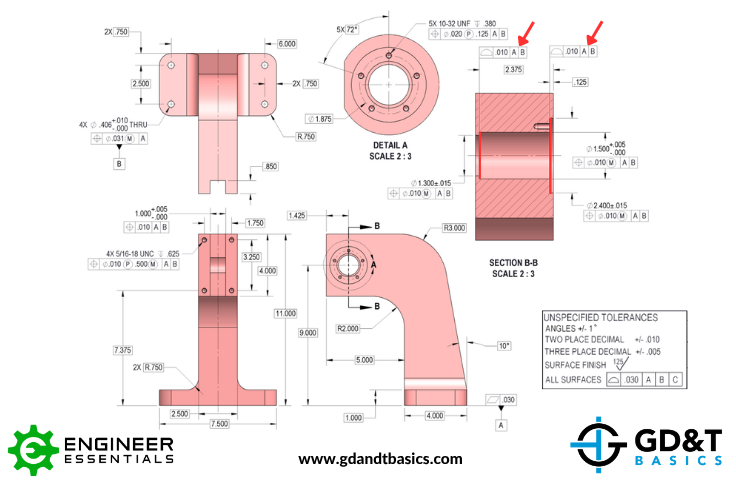
The part in this example, shown above, fits into a larger assembly. The highlighted surfaces are controlled for location, orientation, and form using a profile of a surface tolerance. In this video, Jason is verifying how much profile of a surface tolerance should be allocated to those surfaces to ensure proper function without unnecessarily tightening manufacturing requirements.
To begin, Jason examines the assembly to identify the primary function of the two surfaces and the critical functional requirements—specifically, ensuring the parts fit together while limiting the maximum allowable play. He then walks through the creation of a vector map for this assembly and performs tolerance stack-up calculations to determine whether the assembly will fit and function correctly under worst-case conditions.
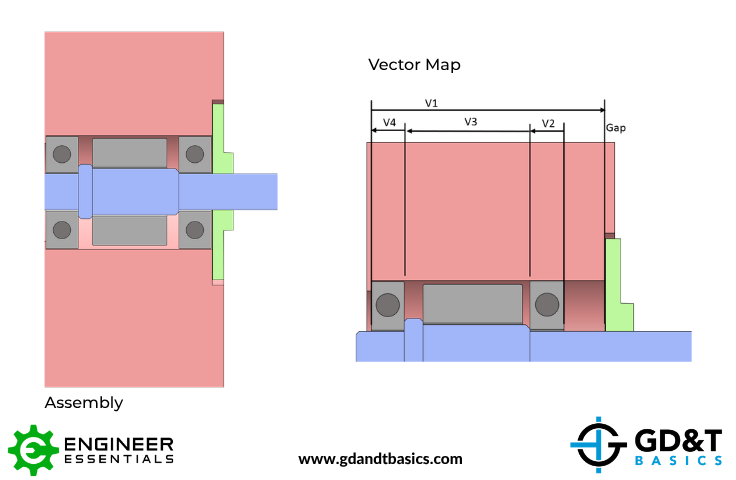
Check out the video for the step-by-step walkthrough of this linear vector tolerance calculation. If you’d like to learn more about tolerance stack-up calculations and the methodology behind them, our GD&T Design course provides the foundational tools and techniques needed to perform these analyses with confidence.
Have a GD&T question? Ask our instructors using the link below!
https://www.gdandtbasics.com/share-your-gdt-questions/
If your question is selected, we will notify you when our video answer is posted to our YouTube channel.
* If you are a current student, reach out to us directly and we will get you into contact with your instructor. Active students’ questions receive a direct response within 24-48 hours.
The one-page GD&T reference that you will use every day
A visual breakdown of every core GD&T symbol and what it controls, all on one page. Bookmark it. Print it. Actually use it.
Download the Chart